Network latency is the delay that occurs when transmitting data or requests from the source to the destination within a network environment. To troubleshoot network latency, follow this step-by-step guide to identify and resolve the underlying issues effectively.
What Causes Network Latency?
Every action that involves using the network, such as opening a web page, clicking a link, or playing an online game, is considered an activity. The time it takes for a web application to respond to these requests is known as response time.
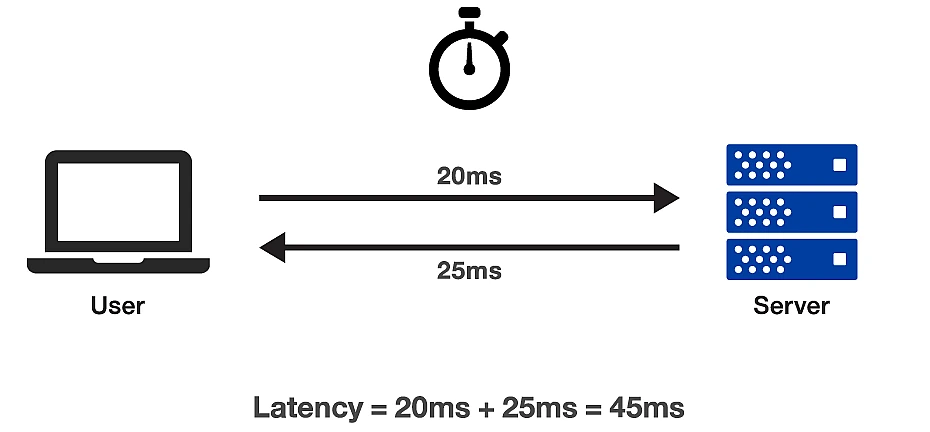
This delay encompasses the time it takes for a server to process the request, resulting in what is known as round trip time – the duration from when a request is sent, processed, to when it’s received and decoded by the user.
Low latency signifies short data transfer delays, which are desirable for optimal user experience. Conversely, long delays or excessive latency can significantly degrade the user experience and should be addressed promptly.
How to Troubleshoot Network Latency with Wireshark
Numerous tools and software are available online for network analysis and troubleshooting, ranging from paid options to free ones. Among these, Wireshark stands out as an open-source, GPL-licensed application designed for real-time packet capture. It is the most widely used network protocol analyzer globally.
Wireshark enables you to capture and display network packets in intricate detail. Once captured, these packets can be analyzed in real-time or offline, offering valuable insights into your network traffic. This tool functions as a microscope for your network, allowing you to filter and drill down into the data to identify the root causes of issues, conduct thorough network analysis, and enhance network security.
What Causes Network Latency?
Few top reasons for the slow network connectivity including :
- High Latency
- Application dependencies
- Packet loss
- Intercepting devices
- Inefficient window sizes
And in this article, we examine each cause of network delay and how to resolve the problems with Wireshark.
Examine and Troubleshoot Network Latency With Wireshark
1. High Latency
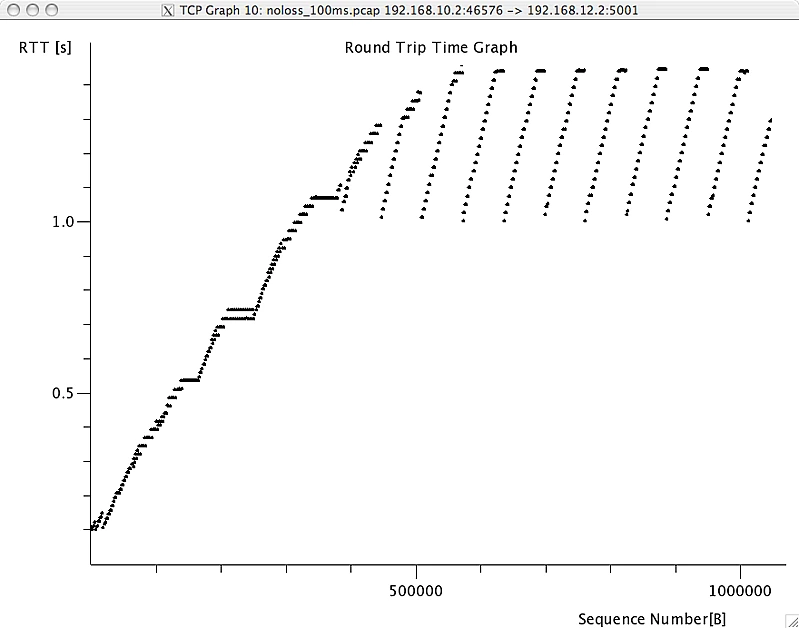
Elevated latency refers to the delay in data transit between endpoints, significantly affecting network communications. In the illustration below, we examine the round-trip time of a file download along a high-latency path. The round-trip latency can frequently exceed one second, which is deemed unacceptable.

- Go to Wireshark Statistics.
- Select the option TCP stream graph.
- Choose the Round Trip time graph to find out how long it takes for a file to download.
Wireshark is employed to measure the round-trip time along a path to determine if it’s causing issues in Transmission Control Protocol (TCP) communications network performance. TCP is utilized in a wide range of applications, such as web browsing, data transmission, and file transfer protocol. Often, operating system settings can be adjusted to enhance performance on high-latency channels, particularly when using Windows XP hosts.
2. Application Dependencies
Certain applications rely on interdependencies with other processes, applications, or host communications. For instance, if your database application needs to connect to other servers to fetch database items, slow performance on those servers can affect the load time of the local application.
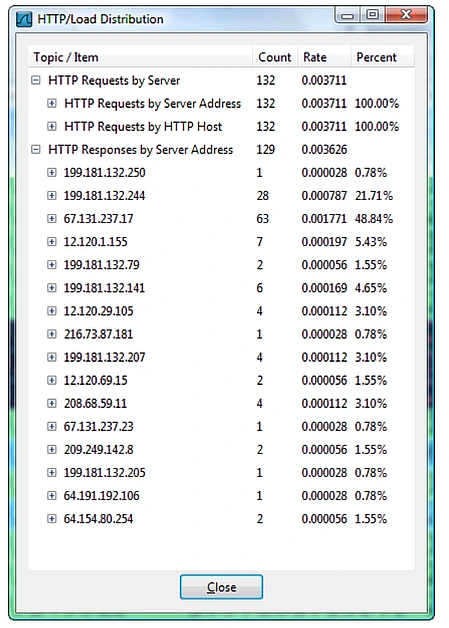
Consider a web browsing scenario where the target server refers to multiple other websites. For example, to load the main page of www.espn.com, you may need to visit 16 hosts that provide advertisements and content for the main page.

In the above figure, The HTTP Load Distribution window in Wireshark displays a list of all servers used by the www.espn.com home page.
3. Packet loss
One common issue frequently encountered on networks is packet loss. Packet loss happens when data packets fail to reach their destination over the internet. When a user accesses a website and starts downloading its elements, missed packets lead to re-transmissions, prolonging the time to download the web files and slowing down the overall process.
Packet loss has a particularly detrimental effect when an application uses TCP. If TCP detects a dropped packet, the throughput rate automatically decreases to address network issues. It gradually improves to a more acceptable pace until the next packet is lost, causing a significant reduction in data throughput. Large file downloads, which should flow smoothly across a network, suffer significantly from packet loss.
What does packet loss look like? It can take two forms when a program operates via TCP. In one scenario, the receiver detects a missing packet based on its sequence number and requests it again (double acknowledgments). When the sender notices that the receiver hasn’t acknowledged the receipt of a data packet, it times out and retransmits the packet.

Wireshark flags network congestion, signaling multiple acknowledgments that trigger the re-transmission of problematic traffic, color-coded for easy identification. A high count of duplicate acknowledgments points to packet loss and significant delays in the network.
Pinpointing the exact location of packet loss is crucial for enhancing network speed. When packet loss occurs, we trace Wireshark down the path until no more packet loss is detected. At this point, we are “upstream” from the packet drop point, allowing us to focus our debugging efforts precisely.
4. Intercepting Devices
Network traffic cops, such as switches, routers, and firewalls, are devices that determine forwarding choices in a network. When packet loss occurs, investigating these devices is crucial as a potential cause.
These linking devices can introduce latency to the path. For instance, if traffic prioritization is enabled, we may observe additional latency injected into a stream with a lower priority level.
5. Inefficient Window Sizes
Aside from the Microsoft operating system, there are other “windows” in TCP/IP networking.
- Sliding Window
- Receiver Window
- Congestion Control window
These windows together constitute the network’s TCP-based communication performance. Let’s start by defining each of these windows & their impact on network bandwidth.
6. Sliding Window
When data is acknowledged, the sliding window is used to send the next TCP segments over the network. As the sender receives acknowledgments for transmitted data fragments, the sliding window expands. This allows larger amounts of data to be transferred as long as there are no lost transmissions on the network.
However, when a packet is lost, the sliding window shrinks because the network cannot handle the increased amount of data on the line.
7. Receiver Window
The TCP stack’s receiver window acts as a buffer space where received data is stored until it’s picked up by an application. If the application doesn’t keep up with the receive rate, the receiver window fills up, leading to a “zero window” scenario. In this situation, all data transmission to the host stops, and throughput rate falls to zero.
To prevent this, Window Scaling (RFC 1323) allows a host to increase the receiver window size, reducing the likelihood of encountering a zero window scenario.

The above picture displays a 32-second delay in network communications due to a zero window scenario.
8. Congestion Window
The congestion window determines the maximum data the network can handle based on factors like the sender’s transmission rate, network packet loss rate, and receiver’s window size. In a healthy network, the congestion window steadily increases until the transfer completes or hits a limit imposed by network conditions, such as the sender’s transmit capabilities or the receiver’s window size. With each new connection, the negotiation for window size starts anew.
Tips for a Healthy Network
- Learn how to utilize Wireshark as a first-response task to quickly and efficiently discover the source of poor performance.
- Identify the source of network path latency and, if possible, reduce it to an acceptable level.
- Locate and resolve the source of packet loss.
- Examine the data transmission window size and, if possible, reduce it.
- Examine intercepting devices’ performance to see if they add latency or drop packets.
- Optimize apps so that they can deliver larger amounts of data and, if possible, retrieve data from the receiver window.
Wrapping Up
To troubleshoot network latency and performance issues effectively, it’s essential to have a deep understanding of network communication patterns. Wireshark as a powerful diagnostic tool, offering a detailed view of network traffic, much like an X-ray or CAT scan for networks. This visibility allows for accurate and timely identification of problems, making Wireshark indispensable for resolving network-related issues. Let’s explore how to resolve network performance challenges using various filters and tools available in Wireshark.


