In today’s business landscape, numerous companies utilize various network hardware, which is often distributed across different physical locations based on their specific functions. To effectively manage this diverse array of equipment, organizations rely on effective Network Monitoring Tools. Some of these network devices can be centrally managed, while others operate in a decentralized manner.
This will bring certain difficulties to the management of computer network equipment.

Because once a network device fails, if the location of the network failure cannot be accurately, timely, and effectively analyzed, the impact on the network information system application based on the network hardware facilities is huge, and the consequences are also very serious.
Therefore, how to accurately and effectively obtain the operating status information of these network infrastructure devices and conveniently and quickly monitor the operating status of network hardware devices has become a major problem that network engineers are facing.
Top 5 Network Monitoring Tools
Considering your actual efficiency needs in work, I would like to recommend 5 network monitoring tools to you, so that you can better improve your work efficiency.
1. OpenNMS
OpenNMS is the abbreviation of Network Management System, which is an open-source software network monitoring tool.
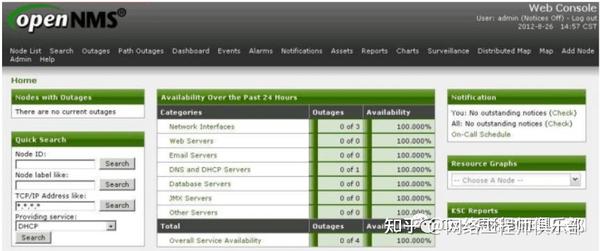
OpenNMS can be used to automatically discover network nodes and monitor network services such as HTTP, DNS, SSH, etc.
When a system service stops, OpenNMS will send notifications based on the rules established by the administrator to inform the operation and maintenance personnel of network failures, event aggregation, automatic execution of corresponding actions, and service-level performance monitoring.
It can support SNMP network management protocol to ensure the scalability of management and provide customized functions to facilitate the expansion of management scope. Traffic and contact system hardware usage need to be configured in SNMP.
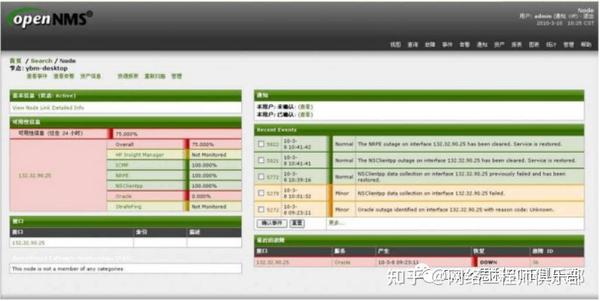
Currently, OpenNMS focuses on the following three areas:
Service Polling – Checks the availability of application services and generates availability reports.
Data Collection – Collect, save, and report network information data, and set and trigger thresholds.
Event and notification management – accepts events from inside and outside the event system, and provides source events to a powerful fault alarm and fault escalation system.
2. SugarNMS
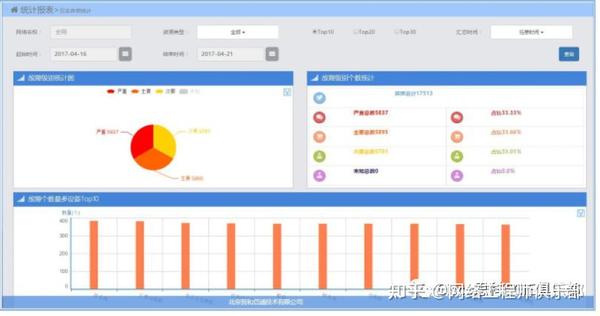
SugarNMS Intelligent Network Management Platform has realized basic network management functions including device topology, fault management, performance management, configuration management, and security management, making it one of the most useful network monitoring tools. It adopts a unified device access model to comprehensively monitor network devices, hosts/servers, middleware applications, Web services, etc.
During the automatic discovery process, network devices can be searched, and the device type and manufacturer model can be identified, a device panel diagram can be generated or device resources can be searched, such as boards, ports, CPUs, memory, disks, etc., and the link relationships between devices can be discovered.
It also has a topology management function, which can display network devices and their connection relationships in the form of a concrete topology diagram, which can be edited by users.
In addition, you can manage devices, device resources, and connections through topology maps.
Of course, it can also collect a variety of fault information and display it promptly. Fault information can be viewed through equipment, resources, and connections, and faults can also be managed through a unified fault management interface.
It also supports a variety of security management functions, such as QOS security policies, MAC-IP binding, blacklist and whitelist, and access control.
3. Nagios
Nagios is an open-source server/network monitoring solution that provides complete monitoring and alerting mechanisms for servers, switches, applications, and services.
Among all the network monitoring tools, it offers a plugin API so you can extend its out-of-the-box functionality. Nagios runs on Linux/Unix platforms and provides an optional browser-based WEB interface to facilitate system administrators to view network status, various system problems, logs, and more.
The main features of Nagios: monitor network services (SMTP, POP3, HTTP, NNTP, PING, etc.), monitor host resources (process, disk, etc.)
Of course, the monitoring capabilities of Nagios can be easily extended through a simple plugin design.
You can also specify a custom event processing controller, and view system monitoring information through your mobile phone. The optional WEB interface allows network engineers to easily view network status, various system problems, and logs.
4. Collectd
Collectd is a daemon process that collects system performance and provides various storage mechanisms to store different values, such as in RRD files.
While the system is running and storing information, Collectd will periodically collect system statistics. This information can be used to identify current system performance bottlenecks, such as for performance analysis, and to predict future system load (such as for capacity planning).
If you need great-looking graphics to display your data and you’re tired of in-house solutions, congratulations, this one is better than other network monitoring tools.
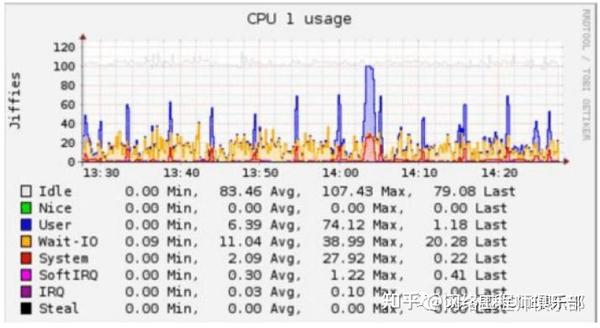
The power of Collectd lies in its rich plug-ins, which are mainly divided into two categories: input and output.
The input plugin is used for periodic queries, and the current value you want to obtain is queried in some way and submitted to the daemon process. For example, the CPU plugin reads the current CPU counters for various parameters (user, system, nice, etc.) and dispatches these values to the daemon.
Output plugins take values from the daemon and process them. Typical applications write to RRD files and CSV files or send data to a remote box over the network. Of course not all plugins can be divided in this way, for example, a network plugin can send output and receive input values.
In addition, this plugin starts a socket port when it is initialized and sends data after receiving it, which is different from other input plugins. You can think of it as a network plugin working asynchronously, which is reasonable.
There are currently two log plug-ins: logfile plug-in and syslog plug-in. Through these plugins, Collectd can provide users with solution information. You can set different log levels.
5. Monit
Monit is a very feature-rich process, file, directory, and device monitoring software for Unix platforms. It can automatically repair programs that have stopped working and is particularly suitable for handling software errors caused by a variety of reasons.
Monit is a cross-platform tool for monitoring Unix/Linux systems (such as Linux, BSD, OSX, and Solaris).
Monit is extremely easy to install, very lightweight, and does not depend on any third-party programs, plugins, or libraries.
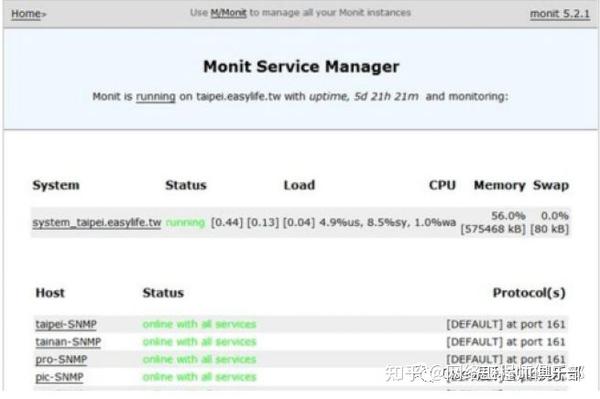
Use Monit to monitor processes, especially useful for monitoring daemons, such as /etc/init.d that are started at system boot time, such as sendmail, ssh, apache, MySQL, etc.
You can use Monit to monitor files, directories, and file systems. Monit can monitor changes to these items, such as timestamps, checksum changes, and file size changes. This is safer. For example, if you change the content of a file, its md5 or sha1 checksum will not change.
Monit can also monitor network links to various servers, local or remote, TCP or UDP, and Unix DomainSockets are all supported. Monit can be used to test programs or scripts at certain times. You can test the return value of the program and take necessary actions based on it, such as executing an action or sending an alert. Of course, Monit can also be used to monitor general system resources, such as CPU usage, memory, and load average.
Conclusion
The effective management of network infrastructure is crucial for organizations operating in today’s complex digital landscape. As highlighted in the article, utilizing robust network monitoring tools like OpenNMS, SugarNMS, Nagios, Collectd, and Monit can significantly enhance operational efficiency and reliability. Each tool offers unique features tailored to various monitoring needs, enabling network engineers to quickly identify and resolve issues, thereby minimizing downtime and maintaining service quality.
By implementing these solutions, organizations can ensure a proactive approach to network management, ultimately supporting their overall business objectives.


