Once you’ve successfully installed Ax3soft Unicorn on your system, you can begin to familiarize yourself with it. Now you finally get to open your fully functioning packet sniffer and see . . . absolutely nothing! Okay, so Unicorn isn’t very interesting when you first open it. In order for things to really get exciting, you need to get some data through Unicorn setup.
Unicorn Setup: Your First Packet Capture
To get packet data into Ax3soft Unicorn, you’ll perform your first packet capture. You may be thinking, “How am I going to capture packets when nothing is wrong on the network?”
First, there is always something wrong on the network. If you don’t believe me, then go ahead and send an email to all of your network users and let them know that everything is working perfectly.
Secondly, there doesn’t need to be something wrong in order for you to perform packet analysis. In fact, most packet analysts spend more time analyzing problem-free traffic than traffic that they are troubleshooting. You need a baseline to compare to in order to be able to effectively troubleshoot network traffic. For example, if you ever hope to solve a problem with DHCP by analyzing its traffic, you must understand what the flow of working DHCP traffic looks like.
More broadly, in order to find anomalies in daily network activity, you must know what normal daily network activity looks like. When your network is running smoothly, you can set your baseline so that you’ll know what its traffic looks like in a normal state.
So, let’s capture some packets!
1. Launch Unicorn
here will be a shortcut icon on the “Desktop” and “Start Menu” after finished installs Unicorn. Launch Unicorn with the following ways:
- Launch from the desktop
Double-click the icon of “Unicorn Network Analyzer” to start the program.
- Launch from Quick Launch Bar
Choose “Unicorn Network Analyzer” in the “Quick Launch Bar” to start the program.
- Launch from the Start menu
Choose the “start> All Programs> Unicorn Network Analyzer” menu to start the program.
Notes: You need to choose a default local network segment in the popup a dialog window, in the first time run Unicorn, if there are more than one network card and each one with different network segment IP in the PC Unicorn installed.
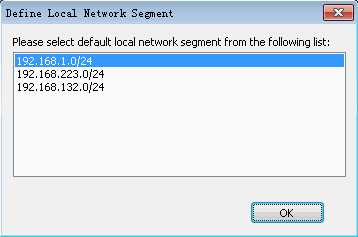
Please choose the network card and then click the OK button.
After unicorn has started, you will see first screen of unicorn to be appeared as below:
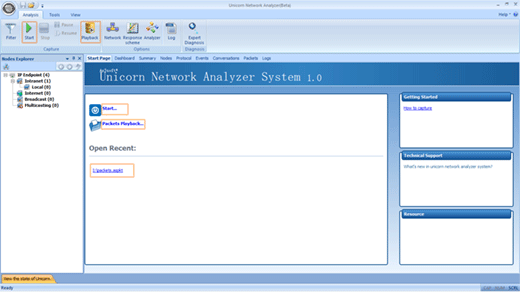
2. Choose “analysis” tab of ribbon section and click the “Start” button to show “Capture Option” window. To do this, you can also click “Start” button in “Start Page” window.
3. Choose network adapters you want to use them to capture packets from the “Adapters” list window. All available network adapters will be listed in the window, including wired and wireless adapters. Data is transmitted over the network via network adapters, also known as Network Interface Card, NIC for short, and network analyzers capture the data through network adapters. When a network adapter is selected, its detail will be display, including Media, Address and Link Speed. Unicorn support one or more network adapters at one time.
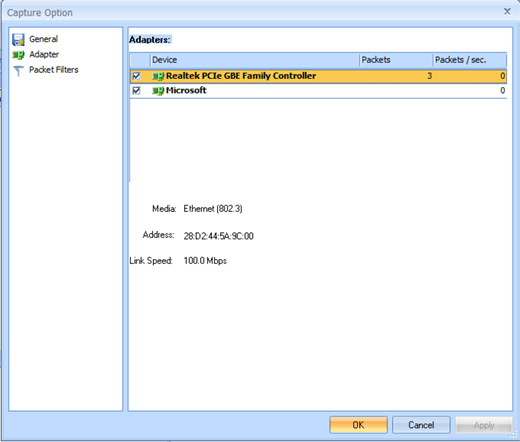
4.Click the “OK” button to capture and analyze network transfer. It is default to capture and analyze all network transfer and save packets to memory buffer, if you just want to analyze some specific packets on the network, you should use packet filters. Click “Creating Filters” for details. Or if you want to save packets to a disk file, click “Capture Option>General” for details.
Unicorn Fundamental: Main Window
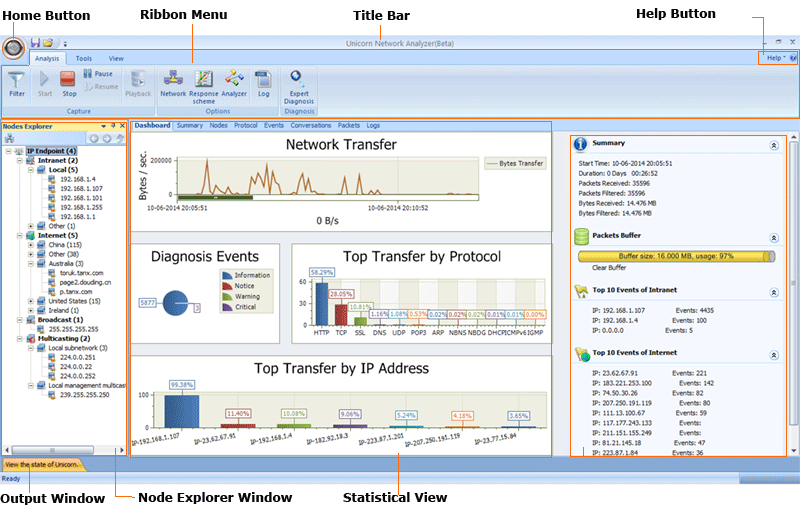
You’ll spend most of your time in the Unicorn main window. This is where all of the packets you capture are displayed. Using the packet capture you just made, let’s take a look at Unicorn’s main window. We adopted new Microsoft Office UI as main user interface of Unicorn; the interface is divided into seven parts, including “Home”button, “Ribbon Command Bar”, “Title Bar”, “Help” button , “Output Window”, “Node Explorer” and “Statistical View”. Unicorn enters the main user interface in which you can start a new project, playback packets, build a filter and so on; all functions provided can be realized on the main user interface. Unicorn intends to offers a summary-to-detail, intuitive, easy-to-use graphical interface to present analysis data, see following figure.
Please choose the network card and then click the OK button.
After unicorn has started, you will see first screen of unicorn to be appeared as below:

2. Choose “analysis” tab of ribbon section and click the “Start” button to show “Capture Option” window. To do this, you can also click “Start” button in “Start Page” window.
3. Choose network adapters you want to use them to capture packets from the “Adapters” list window. All available network adapters will be listed in the window, including wired and wireless adapters. Data is transmitted over the network via network adapters, also known as Network Interface Card, NIC for short, and network analyzers capture the data through network adapters. When a network adapter is selected, its detail will be display, including Media, Address and Link Speed. Unicorn support one or more network adapters at one time.

4.Click the “OK” button to capture and analyze network transfer. It is default to capture and analyze all network transfer and save packets to memory buffer, if you just want to analyze some specific packets on the network, you should use packet filters. Click “Creating Filters” for details. Or if you want to save packets to a disk file, click “Capture Option>General” for details.


